 |
Important: Vicon Nexus 2 is compatible with, and has been tested with MATLAB R2013b. Nexus may function with other versions of MATLAB, but other versions have not been extensively tested by Vicon.
To use MATLAB with Vicon Nexus 2, ensure that, in addition to installing MATLAB, you install .NET Framework version 4.5.
The improved MATLAB interface provides immediate feedback of scripting changes in the 3D Perspective view. This enhancement means that you do not have to save a.c3d file before you can see the results of your scripting changes: with Nexus 2, the effect on the currently loaded trial is displayed as soon as you change your MATLAB script.
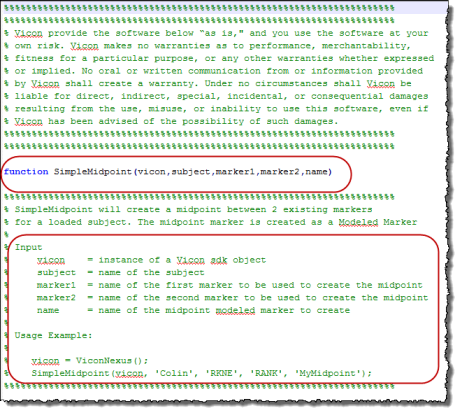
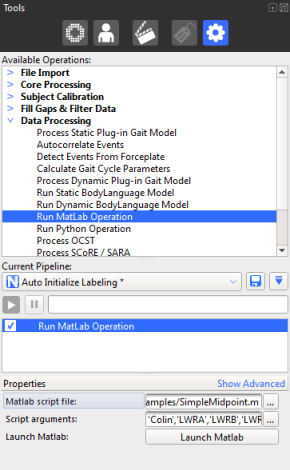
The following example uses a supplied MATLAB script (SimpleMidpoint.m), which is installed with Nexus in the following default folder:
C:\Program Files (x86)\Vicon\Nexus2.x\SDK\Win64\Matlab\Examples
This example script creates a marker mid way between two existing markers in a loaded trial, so you must specify the subject, the two markers between which to create the midpoint, and the name of the midpoint marker that is to be created.
To execute a MATLAB script from within Vicon Nexus:
1. In Nexus, open the trial on which the script is to run.
2. In the Communications window, click on the Matlab tab.
3. In the Matlab script field, enter or browse to the folder that contains the required MATLAB script (*.m).
4. In the Input arguments field, if your script requires arguments, provide a comma-separated list of arguments to be used by the script, surrounding each argument with single quotes. In this example:
’Colin’,’LWRA’,’LWRB’,’LWRM’
The supplied examples show the required input and its format.
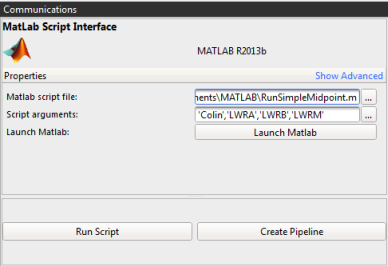
If your script does not require any arguments, leave the Script arguments field blank.
5. If you want to launch MATLAB and display your script, click the Launch Matlab button.
6. Click Run Script.
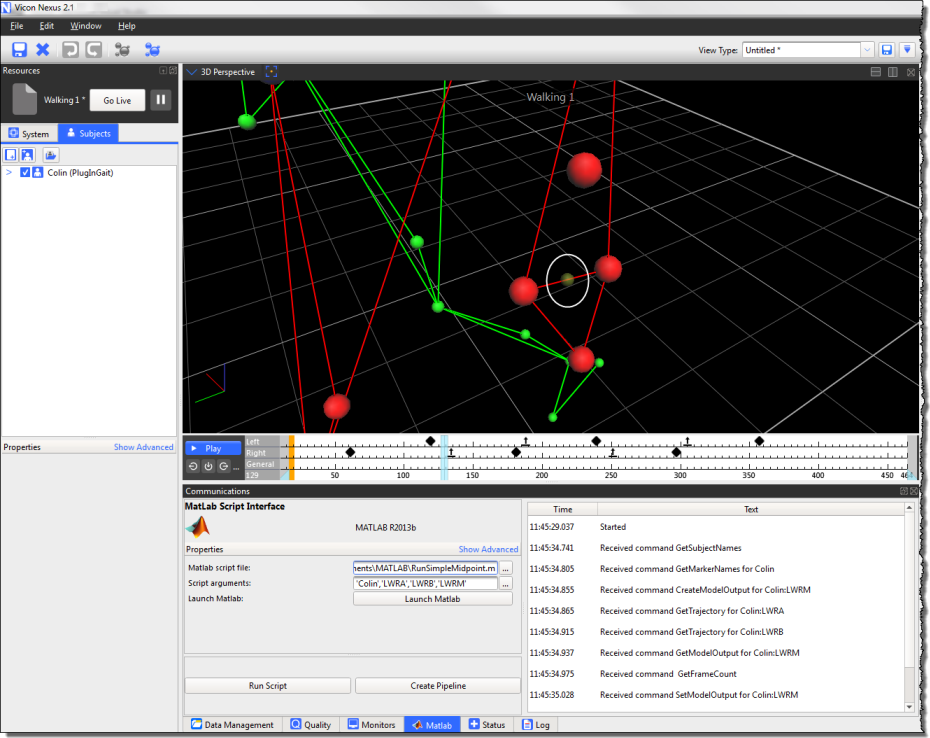
Information, such as a time stamp and text describing the processing, together with any error messages, is displayed on the Matlab tab. Relevant information is also displayed in the Log pane.
The modeled marker (in this case, the midpoint marker, LWRM) is created, and can be seen in the 3D Perspective view.
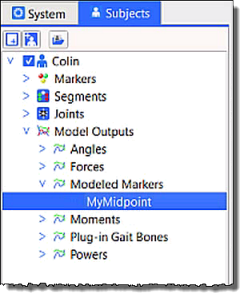
On the Subjects resources pane, additional outputs are displayed under a newly created Modeled Markers node of the resources tree. In the following example, the new marker is called MyMidpoint.
Display a Graph view of the new marker to see that a trajectory for the new marker has been created for the whole trial.
7. If necessary, you can change your script in MATLAB and, to check that it has the desired result, run it again from either MATLAB or by clicking Run Script again.
8. When you have finished refining your script, to include it in a pipeline, click Create Pipeline, which copies the information you have supplied to a Data Processing pipeline operation, Run Matlab Operation in the Pipeline tools pane. The required inputs are displayed in the Properties pane.
For information on how to access the help provided on the relevant MATLAB commands, see MATLAB commands for use with Nexus.
For troubleshooting tips, see MATLAB troubleshooting.
