|
Continuity chart
The Continuity chart is a view in Vicon CaraPost that displays information about which camera views (channels) contribute data to each reconstructed 3D point.
To display the Continuity Chart:
1. Ensure that the view in which you want the Continuity chart to appear is active.
2. At the top right of the camera view(s), click Continuity.
In the Continuity chart, for each point, a colored bar indicates how many channels are contributing to the reconstruction of the 3D point. The meaning of the colors is:
|
Color |
Number of contributing channels |
|
Dark Green |
4 channels |
|
Light Green |
3 channels |
|
Yellow |
2 channels |
|
Orange |
1 channel: single-sensor tracking or interpolation |
|
Red |
0 channels: fully interpolated 3D point |
|
None (ie a gap) |
1 or 0 channels, but with no interpolated 3D point present |
In the Continuity chart you can double-click a point to reveal more detailed channel information for that point, identical to that displayed in the Selected Point pane. The meaning of the colors is:
|
Color |
Meaning |
|
Dark blue |
Blob detection used. |
|
Light blue |
Patch tracking used. (Patch tracking is used if blob detection fails to find a blob and may indicate lower quality data.) |
|
White bar |
A keyframe target-tracked detection is present in that channel. |
|
Colored bar between bright green and red in color |
A non-keyframe target-tracked detection is present in that channel. The color of the bar (between green and red) indicates the health of the 2D target track: green indicates good target tracking results in that channel; red indicates poor target tracking results. |
|
Light blue |
Patch tracking used. (Patch tracking is used if blob detection fails to find a blob and may indicate lower quality data.) |
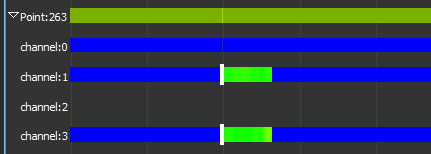
The following screenshot of part of a continuity chart shows the detailed channel contributions for Point 263, which is present in three camera views, with (good) target tracking results in channels 1 and 3 for part of the range.