
 |
Graph view
The Graph view enables you to visualize the 3D (world) and 2D (image) coordinates of selected point(s), for a selected sensor. It can help you to investigate point stability and/or jitter for selected point(s).
To display the Graph view:
1. Ensure that the view in which you want to view the graph is active and that you have selected the point(s) for which to display a graph.
2. At the top right of the camera views, click Graph.
A Graph view for Sensor 0 of the currently selected point(s) is displayed, with the x-axis displaying the frame number, and the y-axis displaying the coordinate value, which for 3D coordinates is in mm, and for 2D coordinates is in pixels.
Use the following mouse/menu actions to work in the Graph view:
|
Required action |
Menu/mouse combination |
|
Display a graph for a sensor other than sensor 0 |
Right-click on the view, and on the on the context menu, point to Sensor, and then click the required sensor name. |
|
Zoom in to the graph range for the data |
Right-click on the view and then click Fit to Data. |
|
Pan in the Graph view |
SHIFT+left+right mouse buttons (or middle mouse button) and drag |
|
Zoom in the Graph view |
SHIFT+right mouse button and drag |
For each selected point, the Graph view displays either:
❙ Three lines (if the point is not visible in the selected sensor), representing the 3D point x, y, and z coordinates plotted against frame number; or
❙ Five lines (if the point is visible in the current sensor), representing 3D point x, y, and z coordinates, and additionally, 2D image x and y coordinates, plotted against frame number.
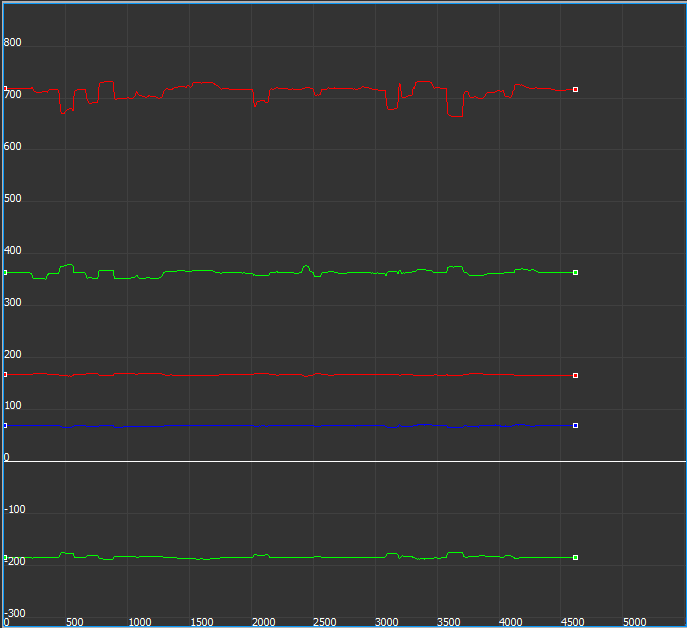
The line color indicates which coordinate is being plotted:
❙ Red = x
❙ Green = y
❙ Blue = z
The following example Graph view shows the 3D and 2D coordinate data for a single point, for sensor 0.
For a complete description of the options available for the view, see 2D, 3D, Graph and Continuity view shortcuts and Graph context menu.